|
Help Page
for the Java-Powered Simulation for Nonlinear Multi-Story Buildings |

|
Introduction
Welcome to the help page of the Java-Powered
Simulation for Nonlinear Multi-Story Buildings.
It is common to design structures to behave nonlinearly under
extreme load conditions, e.g. earthquakes and hurricanes. Therefore, it is
important to instruct students or practitioners to better understand the
effect of nonlinear behavior of buildings. This nonlinear dynamic analysis virtual laboratory (VL)
has been developed for his purpose.
In this VL, users are given wide flexibility
to perform dynamic analysis. Users can choose the number of stories, as well
as select the floor mass, stiffness, and damping coefficients for each story.
Four models, are provided to portray the behavior of the structure. These
modes are: (a) linear stiffness and linear viscous damping; (b) linear stiffness
and nonlinear power-law damping; (c) hysteretic stiffness using the Bouc-Wen
model and linear viscous damping; and (d) hysteretic bilinear stiffness and
linear viscous damping. The same type of model is employed for all columns,
but the parameters defining this model can be varied for each story. Sinusoidal
and four historical earthquake excitations can be chosen for conducting the
dynamic analysis.
This document offers a description of how to
operate and use the Java-Powered Simulation for Nonlinear Multi-Story Building,
a picture of which is shown below, and also the technical background of this
simulation. A number of "homework" problems (or exercises) are suggested
and references are provided.
How to Use
the Simulation
|
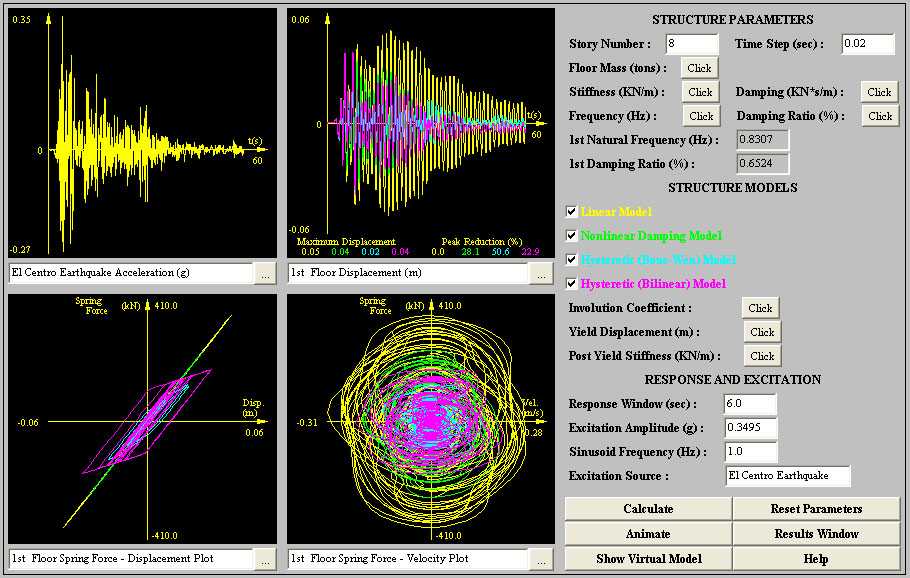
As shown in Figure 1, there are four
response frames on the left of the user interface. On the right, there
is a control panel for conducting structural analysis and changing
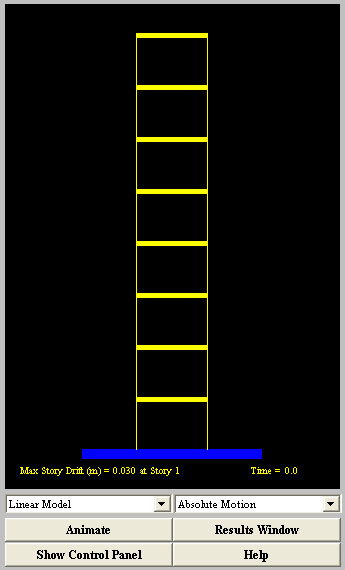
parameters. There is also an animation panel which provides the animated
response through a virtual building model. This panel is shown in
Figure 2. The control panel and animation panel are interchanged with
each other by clicking the Show Virtual Model or Show Control Panel
button located at the lower corner of their panels. A description
of each of these components is given below.
Control Panel
Located on the far right of the simulator,
this panel is used to enter specific data for the structure and excitation.
This panel also contains buttons to do calculation and animation and
the button which links to this help page.
Structure
Parameters
-
Story
Number: total
number of stories. The default is 8 stories.
-
Time Step: time step
for numerical computation. A default time step has been preset
as 0.02 seconds. A smaller time step is expected when the structure
is getting stiffer.
-
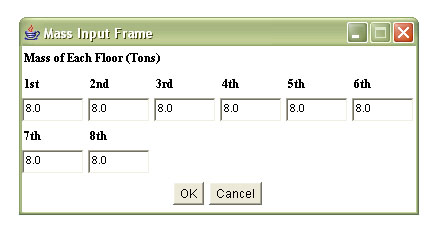
Floor Mass: a dialogue
box (Figure 3) will open when the selection button is pushed,
which allows users to input floor mass for each floor. The default
value is 8.0 tons.
-
Stiffness: linear
stiffness for each story. The default value is 7000 KN/m.
-
Damping: viscous
damping coefficient for each story. The default value is 10.0
KN*s/m.
-
Frequency: natural
frequencies associated with the structural parameters. These natural
frequencies are automatically updated when any structural parameters
are changed.
-
Damping Ratio: damping
ratio associated with the structural parameters. These damping
ratios are automatically updated when any structural parameters
are changed.
-
1st Natural
Frequency: for convenience, the first natural frequency is
displayed in the main interface.
-
1st damping
Ratio: for convenience, the first damping ratio is displayed
in the main interface.
Structure Models
|
|
|
Figure 2. Animation Panel
|
|
|
| Figure
3. Mass Input Frame |
analysis results can be displayed. The default is to display the
structural behavior
described by linear model.
-
Involution Coefficient:
parameters associated with the nonlinear damping model. The default
is 0.5.
-
Yield Displacement:
displacement when exceeded, the Bouc-Wen model and the bilinear
model change from elastic to plastic region. The default is 0.02
m.
-
Response Window:
width of the response frames (in seconds) during the animation.
The default is 6.0 seconds.
Response and Excitation
-
Excitation Amplitude:
by changing this value, the excitation magnitude can be scaled.
-
Sinusoid Frequency:
frequency component for the sinusoid excitation. The default
value is 1.0 Hz.
-
Excitation Source:
display the name of the current excitation. The default excitation
is the El Centro Earthquake.
Action Buttons
-
Calculate: conduct
calculation.
-
Reset Parameters:
resets all the parameters to default values.
-
Animate: start/stop
animation in the response frames as well as the animation
panel.
-
Results Window:
display important analysis results after each computation.
-
Show Virtual Model:
by clicking this button, the control panel and animation panel
are interchanged with each other.
-
Help: pop up
the help page when pushed.
Animation Panel
The animation frame, interchangeable
with the control panel, shows the behavior of the multi-story
building under the specified excitation.
Buildings, described using Linear
Model, Nonlinear Damping Model, Bouc-Wen Model and Bilinear Model,
can be animated by the appropriate selection in the left choice
of this frame.
The user can also choose to animate
absolute or relative motion of the structure:
-
Absolute Motion: Display
the absolute motion of the structure. Thus, the ground is
seen moving.
-
Relative Motion:
Display the motion of the structure relative to the ground.
Thus, the ground is seen not moving.
|
Response
Frames
|
There are four response frames on the left of the simulator. The functions
of these four response frames are identical, except that the top left frame
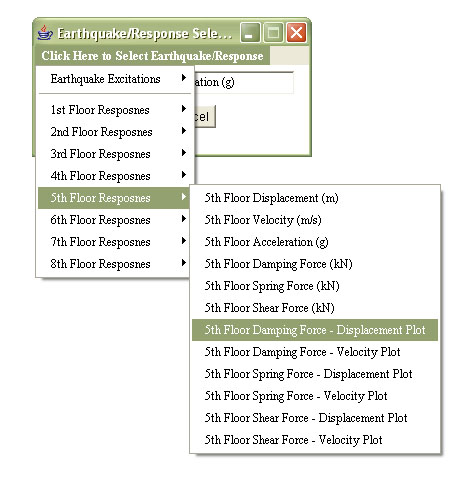
can also display the earthquake excitation. There is a selection button at
the lower right corner of each frame. For the top left frame, this selection
button brings up a dialogue box (shown in Figure 4) for user to select the
earthquake excitation or response to display. For the other three response
frames, the selection button brings up a similar dialogue box for a response
selection only.
Peak response information such as the maximum value of each response, peak
reduction (= maximum peak of each case / maximum peak of Linear Model case *
100 (%)) is displayed in the bottom of this frame.
On the top left of the
simulator, the response frame can show current excitation signal, either in
displacement or acceleration. Five historical excitation records are
available for simulation:
-
Sinusoidal Input: the
default value of the frequency is 1.0 Hz. The default value of the maximum
acceleration is 0.3g.
-
El Centro Earthquake:
North-south component recorded at the Imperial Valley Irrigation District
substation in El Centro, California, during the Imperial Valley, California
earthquake of May 18, 1940. The magnitude is 7.1 and the maximum ground
acceleration is 0.3495g.
-
Tokachi-oki (Hachinohe) Earthquake: North-south component recorded
at Hachinohe City during the Tokachi-oki earthquake of May 16, 1968.
The magnitude is 7.9 and the maximum ground acceleration is 0.2294g.
|
 |
|
Figure 4.
Earthquake/Response Selection Frame
|
-
Tokachi-oki (Hachinohe) Earthquake: North-south component recorded
at Hachinohe City during the Tokachi-oki earthquake of May 16, 1968.
The magnitude is 7.9 and the maximum ground acceleration is 0.2294g.
-
Northridge Earthquake: North-south component
recorded at Sylmar County Hospital parking lot in Sylmar, California,
during the Northridge, California earthquake of Jan. 17, 1994. The magnitude
is 6.8 and the maximum ground acceleration is 0.8428 g.
-
Hyogo-ken Nanbu (Kobe) Earthquake:
North-south component recorded at Kobe Japanese Meteorological Agency
(JMA) station during the Hyogo-ken Nanbu (Kobe) earthquake of Jan. 17,
1995. The magnitude is 7.2 and the maximum ground acceleration is 0.8337g.